
Recent studies of on-line audio consumption by Bridge Ratings as well as fellow research organization Edison Research show confirmation of trends that consumption of Pandora's ten year radio offering (not its new on-demand platform) is not only slowing but is falling.
Primarily impacted by Spotify, Apple Music and iHeartRadio, Pandora has been showing signs of weakening listener engagement for some time in Bridge Ratings annual studies.
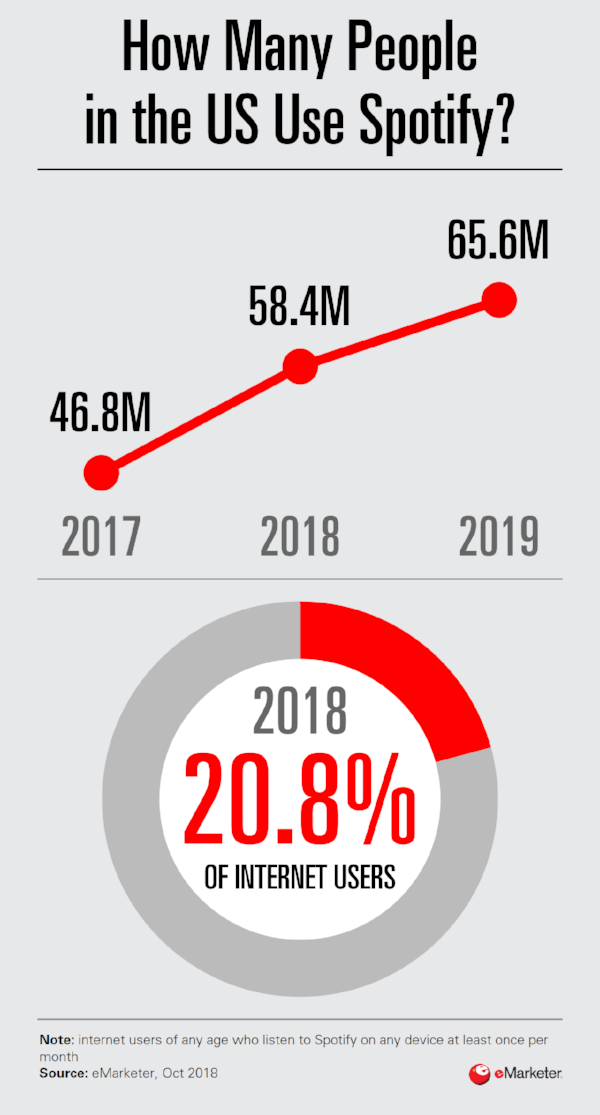
We expect Pandora's US user base to decline slightly through the forecast period, while Spotify will see double-digit growth in 2018, as well as in 2019.
Bridge Ratings recently concluded a large-sample, four-month study of streaming music providers and pure-play internet radio companies (Pandora, Spotify) and released user behavior overviews this year.
An overall analysis of user behavior for the music streaming platforms included in this study will be published in a separate release. Today we will focus on Pandora.
As further data is analyzed Pandora consumer behavior is becoming clarified and the perceptions of Pandora's massive user base are becoming more clear.
While Spotify claims around 58 million users by year-end 2018, Pandora’s user base stands at 76 million and is decreasing.
The Pandora User Mix
In the most recent data released this week from Bridge Ratings, thoughts on Pandora's music mix and presentation have been identified across a panel of nearly 3000 Pandora users as Pandora "Primes" and Pandora "Moderates".
41% of our sample are considered "Primes", Pandora users who spend at least two hours a day with Pandora for at least three days each week. This number is down from 47% two years ago when we published our initial report. These are heavy consumers of Pandora and generally have positive perceptions of the service. For this 41% of Pandora's total user base, the company has found a combination of services that highly fulfill their needs. The addition of Pandora Prime, their on-demand service which competes directly with Spotify and Apple Music, has added new subscribers - 22% coming from their free-tier user base.
31% of our sample are defined as "Moderates", Pandora users who spend at least an hour a day with Pandora at least two days each week. These registered users have mixed opinions of the service and at times as many at 53% of this group has discontinued their usual usage for as much as weeks at time due to listening dissatisfaction such as repetition of songs or the company's algorithm not hitting the music target more often than not.

Interestingly, this self-forced Pandora "vacation" that a portion of this group of users tends to take resets their consumption expectations of the service. However, with each experience disappointment Pandora serves up to these users, the "favoriteness" factor diminishes.(Favoriteness is defined as "the service used most").
Perceptions
The following chart compares the perceptions of these two user groups over a series of six "experience benchmarks" of the Pandora service:
Does the Pandora service meet your needs? Do you like the service as it is?
Repetition of songs or artists
Commercials
Does the music on Pandora match your tastes? Does the music mix appeal to you?
Do you like discovering new music and artists?
How familiar is the music to you?
The chart is self-explanatory but reveals behavior truths that are seldom publicized. For example, while 81% of Pandora Primes like the service as it is (down from 90% in 2016), 55% of the Moderate user group does. For many of these users Pandora does not meet their needs.
Pandora Moderates notice song repetition while 34% of Primes do. Commercials in the free tier are an overwhelming issue for Moderates.
The Pandora "Lights" group (28% of the total not seen on this chart), or very light users includes a group of Pandora registered users who no longer use the service because the computerized music selection never or hardly ever delivers on its promise.
User Trends 2018
While we estimate overall Pandora user counts total around 76 million in the U.S., the company’s on-demand streaming offering, Pandora Prime, is estimated at around 8 million at year-end 2018. This compares to 58 million for Spotify, 50 million for Apple Music and 30 million for Amazon. The growth trajectories for the three on-demand streaming platforms (Spotify, Apple and Amazon) continue to explode while Pandora’s free-tier is in decline (see chart above).
A key factor in usage for these companies is a “Favoriteness” rating which focuses on those users who are considered heavy users with daily time-spent at least two hours. The chart below compares favoriteness 2018 vs. 2016. Pandora’s decreasing preference numbers is a function of the above chart which highlights user perceptions of their experience.

Summation
The Pandora service is hitting many of the right "buttons" of the heavy users of the service, however our study shows the majority of registered users in our sample are inclined to use the service less over time.
Methodology: Pandora consumers were contacted through a random digit-dialing method between October 17 and November 4, 2016. Consumers were segregated into groups based on time spent listening to the music platform. 1640 were members of the "Pandora Primes" group - those who were the heaviest weekly consumers of more than 10 hours per week. 1240 consumers were members of the "Pandora Moderates" - those who spent between 3.5 and 7 hours per week with Pandora. The "Pandora Primes" group was 55% Male/45% female. The "Pandora Moderates group was 52% Male/48% female. All members of both groups were between 13 and 65 years of age.